图表
1.进度条

<div class="progress-bar">
   <div class="progress"></div>
</div>
.progress-bar {
height: 18 * @uh;
margin: 10 * @uh 0 0 0;
background: #073866;
display: flex;
align-items: center;
.progress {
position: relative;
width: 120px;
display: flex;
align-items: center;
&::before,
&::after {
content: '';
position: absolute;
left: 0;
width: 100%;
height: 11 * @uh;
}
&::before {
z-index: 1;
background: linear-gradient(90deg, #0742b9, #1bdffc);
}
&::after {
z-index: 2;
background: linear-gradient(
to right,
#073866 0%,
#073866 25%,
transparent 25%,
transparent 50%,
#073866 50%,
#073866 75%,
transparent 75%,
transparent 100%
);
background-size: 20px 12px !important;
}
}
}2.仪表盘
- 案例1
<!--
 * @Description:仪表盘
 * @Autor: wxy
 * @Date: 2020-12-25 11:48:49
 * @LastEditors: wxy
 * @LastEditTime: 2020-12-25 14:21:07
-->
<template>
  <div>
    <div class="gauge-item" ref="chart"></div>
    <img
      src="@/assets/image/home/gauge-bg.png"
      id="bg_img"
      style="display: none"
    />
  </div>
</template>
<script>
export default {
  name: 'Gauge',
  data () {
    return {}
  },
  mounted () {
    this.drawGauge()
  },
  computed: {},
  methods: {
    /**
     * @description: 绘制仪表盘
     * @author: wxy
     */
    drawGauge () {
      const value = 0.8 // 值,0~1之间
      const startAngle = 215 // 开始角度
      const endAngle = -35 // 结束角度
      const splitCount = 20 // 刻度数量
      const pointerAngle = (startAngle - endAngle) * (1 - value) + endAngle // 当前指针(值)角度
      const myChart = this.$echarts.init(this.$refs.chart)
      const option = {
        series: [
          {
            type: 'gauge',
            radius: '95%',
            startAngle: pointerAngle,
            endAngle: endAngle,
            splitNumber: 1,
            axisLine: {
              show: false,
              lineStyle: {
                width: 2,
                opacity: 0
              }
            },
            title: { show: false },
            detail: { show: false },
            splitLine: { show: false },
            axisTick: {
              length: 4,
              splitNumber: Math.ceil((1 - value) * splitCount),
              lineStyle: {
                color: '#001242',
                width: 2
              }
            },
            axisLabel: { show: false },
            pointer: { show: false },
            itemStyle: {}
          },
          {
            type: 'gauge',
            radius: '100%',
            startAngle: startAngle,
            endAngle: pointerAngle,
            splitNumber: 1,
            axisLine: {
              show: false,
              lineStyle: {
                width: 1,
                opacity: 0
              }
            },
            title: { show: false },
            detail: {
              formatter: '{value}%',
              textStyle: {
                fontWeight: 'bolder',
                fontSize: 10,
                color: 'white'
              },
              offsetCenter: [0, 0]
            },
            splitLine: { show: false },
            axisTick: {
              length: 4,
              splitNumber: Math.ceil(value * splitCount),
              lineStyle: {
                color: {
                  image: document.getElementById('bg_img'), // bg_img渐变颜色图片
                  repeat: 'no-repeat'
                },
                width: 2
              }
            },
            axisLabel: { show: false },
            pointer: { show: false },
            itemStyle: {},
            data: [
              {
                value: value
              }
            ]
          }
        ]
      }
      myChart.setOption(option)
    }
  }
}
</script>
<style lang="less" scoped>
.gauge-item {
  width: 65 * @uw;
  height: 65 * @uh;
}
</style>
案例2
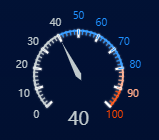
<!--
 * @Description:仪表盘
 * @Autor: wxy
 * @Date: 2020-12-29 19:47:14
 * @LastEditors: wxy
 * @LastEditTime: 2020-12-29 20:15:32
-->
<template>
    <div id="gauge-id" ref="chart"></div>
</template>
<script>
export default {
  name: 'Gauge',
  data () {
    return {
    }
  },
  mounted () {
    this.drawGauge()
  },
  computed: {
  },
  methods: {
    /**
     * @description:绘制电机转速
     * @author: wxy
     */
    drawGauge () {
      const myChart = this.$echarts.init(this.$refs.chart)
      const option = {
        tooltip: {
          formatter: '{a} <br/>{c} {b}'
        },
        series: [
          {
            name: '速度',
            type: 'gauge',
            radius: '70%',
            axisLine: { // 坐标轴线
              lineStyle: { // 属性lineStyle控制线条样式
                color: [[0.4, '#BFC9CC'], [0.8, '#1e90ff'], [0.9, '#FEA787'], [1, '#ff4500']],
                width: 2
              }
            },
            axisLabel: { // 坐标轴小标记
              fontWeight: 'bolder',
              shadowBlur: 10,
              fontSize: '12px',
              distance: -26 // 值设置在外环
            },
            axisTick: { // 坐标轴小标记
              length: 5, // 属性length控制线长
              lineStyle: { // 属性lineStyle控制线条样式
                color: 'auto',
                shadowColor: '#fff', // 默认透明
                shadowBlur: 2
              }
            },
            splitLine: { // 分隔线
              length: 8, // 属性length控制线长
              lineStyle: { // 属性lineStyle(详见lineStyle)控制线条样式
                width: 2,
                color: '#fff',
                shadowColor: '#fff', // 默认透明
                shadowBlur: 2
              }
            },
            pointer: {
              width: 3, // 分隔线
              shadowColor: '#fff', // 默认透明
              shadowBlur: 5
            },
            detail: {
              formatter: '{value}',
              offsetCenter: [0, '100%'],
              textStyle: {
                color: 'auto',
                fontSize: '18'
              }
            },
            data: [{ value: 40 }]
          }
        ]
      }
      myChart.setOption(option)
    }
  }
}
</script>
<style lang="less" scoped>
#gauge-id{
  width: 100%;
  height: 150*@uh;
}
</style>
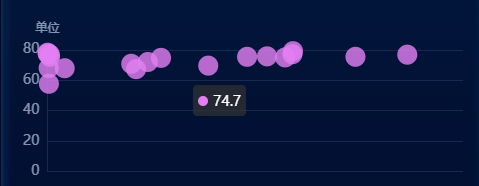
3.散点图
<!--
 * @Description:散点图
 * @Autor: wxy
 * @Date: 2020-12-28 19:55:54
 * @LastEditors: wxy
 * @LastEditTime: 2020-12-28 20:45:41
-->
<template>
    <div>
      <div id="testing-apparatus-id" ref="chart"></div>
    </div>
</template>
<script>
export default {
  name: '',
  props: {
    colorArr: {
      type: String,
      default: '#E37FF2'
    }
  },
  data () {
    return {
    }
  },
  mounted () {
    this.drawScatter(this.colorArr)
  },
  computed: {
  },
  methods: {
    /**
     * @description: 绘制散点图
     * @author: wxy
     */
    drawScatter (colorArr) {
      const myChart = this.$echarts.init(this.$refs.chart)
      const data = [[286, 77, 170, 'Australia', 1990], [33, 77.4, 240, 'Canada', 190], [151, 68, 113, 'China', 1990], [13670, 74.7, 10582082, 'Cuba', 1990], [28599, 75, 4986705, 'Finland', 1990], [29476, 77.1, 56943299, 'France', 1990], [314, 75.4, 789, 'Germany', 1990], [28, 78.1, 230, 'Iceland', 1990], [177, 57.7, 8601776, 'India', 1990], [29550, 79.1, 122249285, 'Japan', 1990], [2076, 67.9, 20194354, 'North Korea', 1990], [12087, 72, 42972254, 'South Korea', 1990], [24021, 75.4, 3397534, 'New Zealand', 1990], [43296, 76.8, 4240375, 'Norway', 1990], [10088, 70.8, 38195258, 'Poland', 1990], [19349, 69.6, 147568552, 'Russia', 1990], [10670, 67.3, 53994605, 'Turkey', 1990], [26424, 75.7, 57110117, 'United Kingdom', 1990], [37062, 75.4, 252847810, 'United States', 1990]]
      const option = {
        grid: {
          left: '0%',
          right: '0%',
          bottom: '10%',
          top: '20%',
          containLabel: true
        },
        tooltip: {
          axisPointer: {
            type: 'none'
          }
        },
        xAxis: {
          axisLabel: {
            show: false,
            color: 'rgba(216, 233, 255, 0.6)',
            fontSize: 14 // 更改坐标轴文字大小
          },
          splitLine: {
            show: false
          },
          axisTick: {
            show: false // 不显示坐标轴刻度
          },
          axisLine: {
            lineStyle: {
              color: '#162A4D'
            }
          }
        },
        yAxis: {
          name: '单位',
          nameTextStyle: {
            color: 'rgba(216, 233, 255, 0.6)'
          },
          axisLabel: {
            color: 'rgba(216, 233, 255, 0.6)',
            fontSize: 14 // 更改坐标轴文字大小
          },
          axisTick: {
            show: false // 不显示坐标轴刻度
          },
          splitLine: {
            show: true,
            lineStyle: {
              color: ['#162A4D'],
              width: 1,
              type: 'solid'
            }
          },
          axisLine: {
            lineStyle: {
              color: '#162A4D'
            }
          }
        },
        series: [
          {
            symbolSize: 20,
            data: data,
            itemStyle: {
              normal: {
                color: colorArr
              }
            },
            type: 'scatter'
          }
        ]
      }

      myChart.setOption(option)
    }
  }
}
</script>
<style lang="less" scoped>
  #testing-apparatus-id {
    width: 440 * @uw;
    height: 200 * @uh;
  }
</style>